
To show data in table format are very effective way of showing data as visualization, specially when you have more measures input control to show as columns. In table, if you like to perform the calculation between columns you can perform easily using 2 method to generate calculated column in SAP analytics Cloud.
With calculated columns, you can create new columns that are derived from existing column in table, enabling you to do the advanced analysis, enhanced reporting, and dynamic insights with new calculation, example Variance calculation, YoY calculation etc.
What Are the Calculated Column in SAP Analytics Cloud?
A calculated column is a column that does not exist in your data source or table, but it is created by you applying a calculation or formula to existing columns within your data or table layout. These columns can be used to create new metrics, aggregate data, or apply logic to your reports, stories, dashboard and analysis.
Calculated columns in SAC are really useful for you for below reasons:
- You can perform mathematical operations like addition, subtraction, multiplication, or division.
- Apply conditional logic to derive new values (example if and else statement to the column)
- Create custom columns to bring meaningful value or insight in you visualization.
Calculated column in SAP Analytics Cloud have two method to do:
- Method 1: Calculated column using existing Mathematical Function
- Method 1: Calculated column using to put Manual Formula in each cell of column
How to do Calculated Column Calculation in SAP Analytics Cloud
let see below steps with example how you can perform table Column Calculation in SAP Analytics Cloud
Method 1: Calculated column using existing Mathematical Function
In Method#1 you need to select any two column on which you want to perform the mathematical calculation like Sum, Subtract, Divide and multiply etc.
Steps:
- Start your story and insert canvas option in story board

- Select table option in the story board to see the table structure layout

- First you need to select measure and dimension as row and column to make the desire table on which you want to perform the calculation task
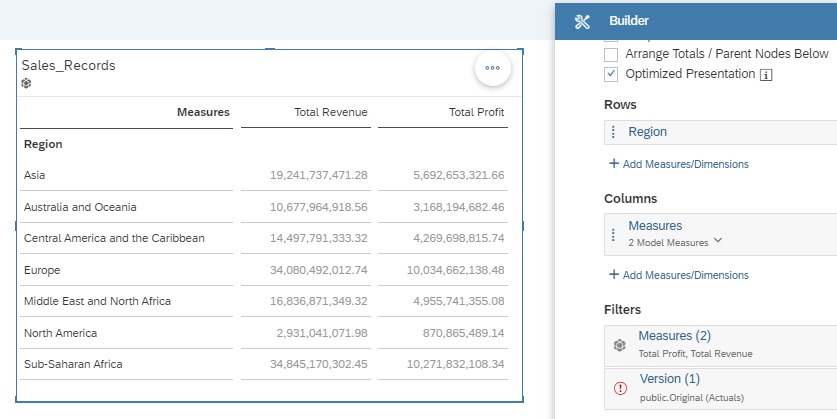
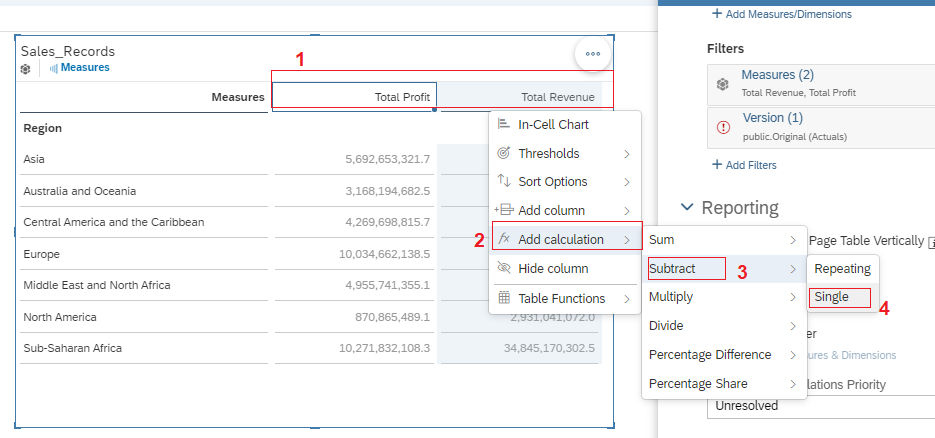
- In below image we have selected two columns “Total profit” and “total Revenue”
- And after the selection of these two column right click on column header and then select > Add calculation > Subtract
- sometime new column inserted into the middle of these two column then you need to sort it and the new column will go to the end column
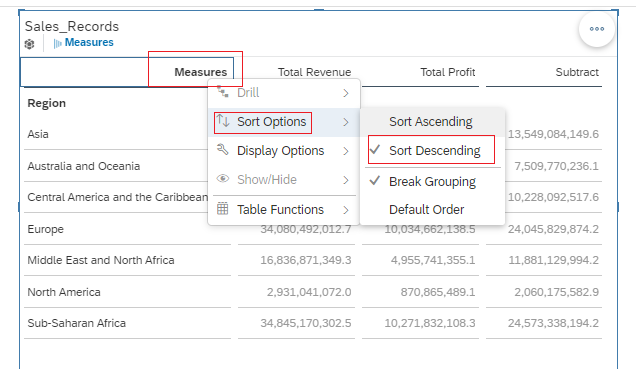
- As you can see below is the final subtraction table.
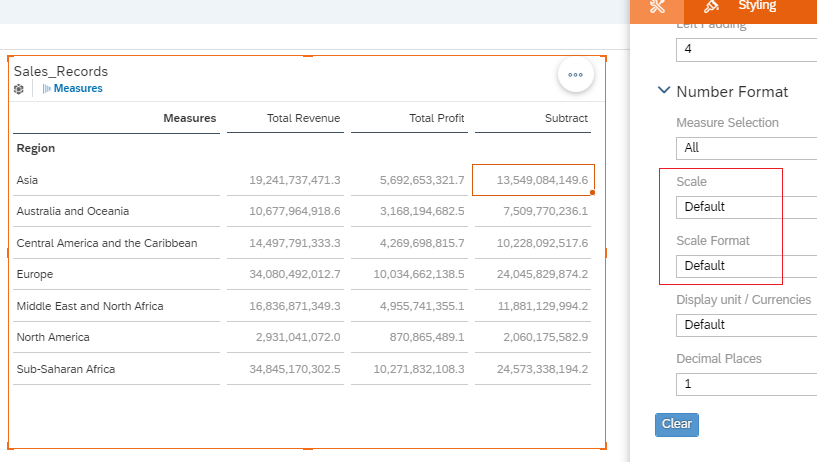
Limitation:
Limitation is that you can change the format of numbers only aligned with the other two tables, Suppose if you want to calculate % between two column, then you can’t change the format of new column into %. It will remain the numbers. You can see on above image that we have only number format no % format.
For that you can use the below method#2 if you want to calculate %.
Method 2: Calculated column using to put Manual Formula in header of column
Steps:
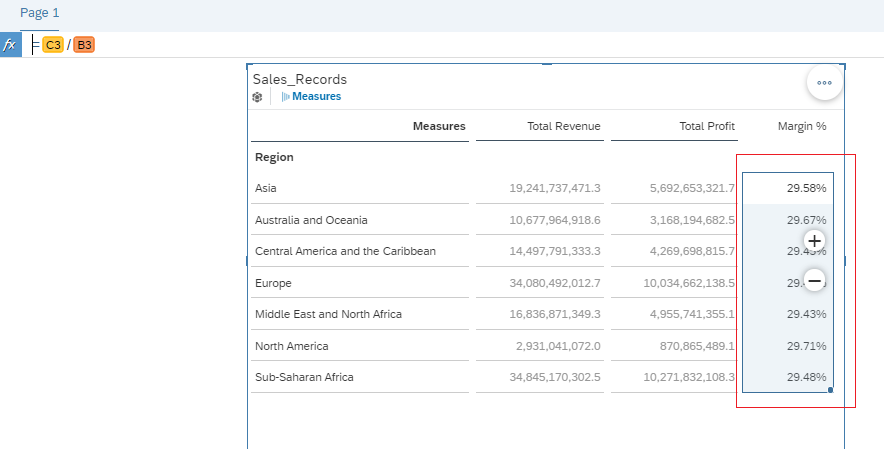
- Just insert new blank column using “+” sign on the right side of table as shown below image
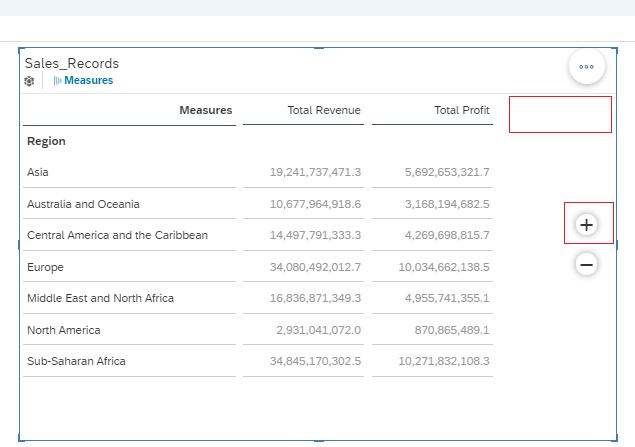
- Now name the header as Margin% by double click on the header cell
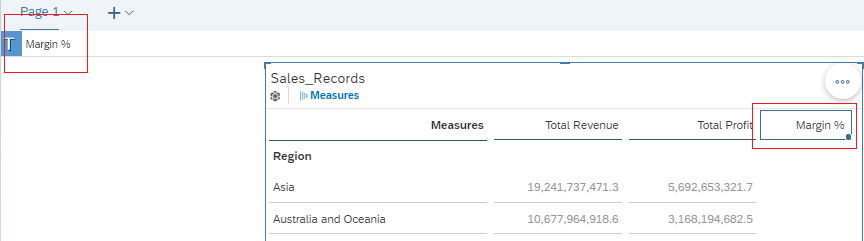
- Now double click on first cell and type the simple formula as you do in Excel, because table in SAP analytics cloud treat as excel table
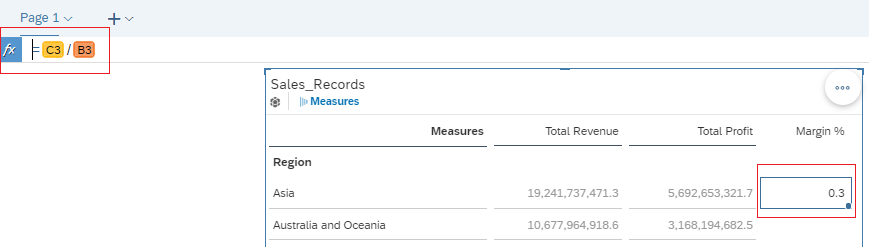
- Here we have formula = C3 / B3 and you will see the output numbers in decimal place in that particular cell
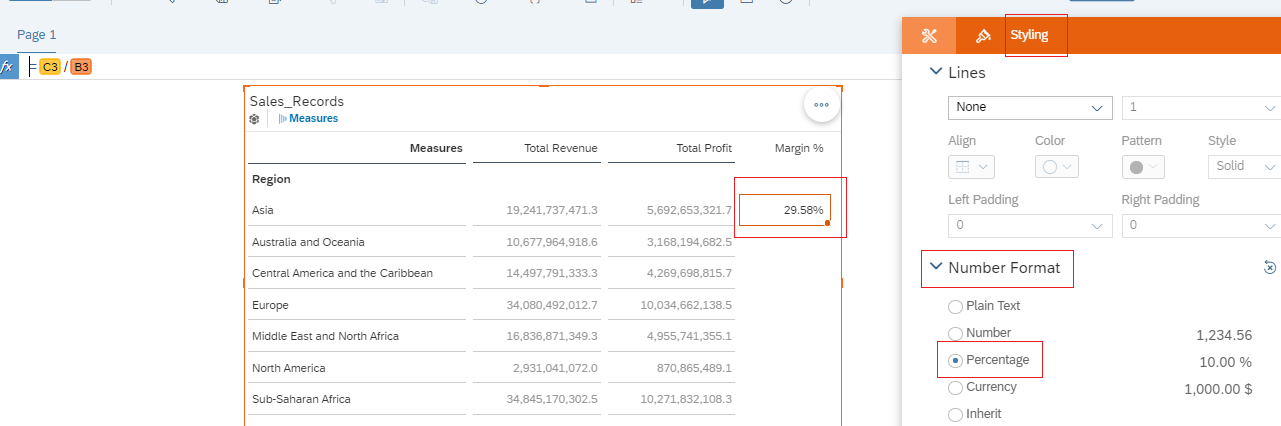
- Now, select that particular cell and click on style option from left side window and you will see “Number Format” option which have % .
- Select Percentage radio button and you will see cell numbers changed into %
- Now you can drag the cell Up to the end rows OR you can also copy the cell and drag below till end row. In both case formula will get dragged
Few Best Practices for Using Calculated Columns in SAC
Calculated columns offer more flexibility to improve your insight of data. However, there are a few best practices to keep in mind when using them in SAP Analytics Cloud:
- Limit Complexity: Try to keep calculated columns as simple as possible. Complex formulas can sometimes lead to slower the performance, especially when working with large datasets. and also try to avoid nesting too many functions within one calculated column in SAC.
- Give Descriptive Names to Column: Naming your calculated columns should be recognizable to the end users. Instead of a generic name like “Column1”, use descriptive names like “Gross Profit” or “Compound Annual Growth” so that other users can easily understand what the column represents.
- Test Your Formulas: Test the formulas to ensure that they return the expected results. You can start with a small subset of data to verify accuracy of formula.
- Optimize Performance: If you need to use multiple calculated columns, consider creating a custom data model that includes only the necessary columns and calculations. This can help optimize the performance of your reports and dashboards.
- Document Your Calculations: If you’re working on a large project, it is best practice to document your calculated columns and formulas. This helps ensure consistency and provides clarity for future users or you backup in your organization.
Conclusion:
Calculated columns in a table is a powerful feature in SAP Analytics Cloud that allow you to enrich your data models, create custom metrics, and transform raw data into meaningful insights. By leveraging calculated columns effectively, you can do deeper analysis, improve your reports or Stories, and ensure that your data is presented in the most useful way.