
SAP Analytics Cloud Analytics Designer: What It Is and How to Start
Stories in SAP Analytics Cloud (SAC) are great until you need something they can not do, like a drop-down that rewires a chart or a button that opens a details popup. That is where SAP analytics cloud analytics designer comes in.
In today’s tutorial you will learn what it is, how it differs from stories, what the workspace looks like, and how to create your first analytic application.
Why learn SAC analytics designer?
Many BI tools avoid scripting to keep things simple. That feels easier at first, but you soon hit the limits of what the tool was built to do.
Scripting lets you go beyond preset narratives, respond to user clicks in a custom way, change result sets, and alter the layout dynamically. If you have ever thought “I wish this dashboard could just do X”, analytics designer is usually the answer.
What is an analytic application?
SAP Analytics Cloud analytic designer application presents data in various forms, lets users navigate SAC, and can support planning. It can be a simple static dashboard or a highly customized app with rich navigation, changing visualizations, several areas, and your company’s branding.
Analytics designer is the part of SAC where you build these applications. “Design” here means more than layout. It covers the whole process, defining the data model, laying out the screen, configuring widgets, and wiring everything together with custom scripts.
SAC Stories vs. SAP Analytics Cloud analytics designer
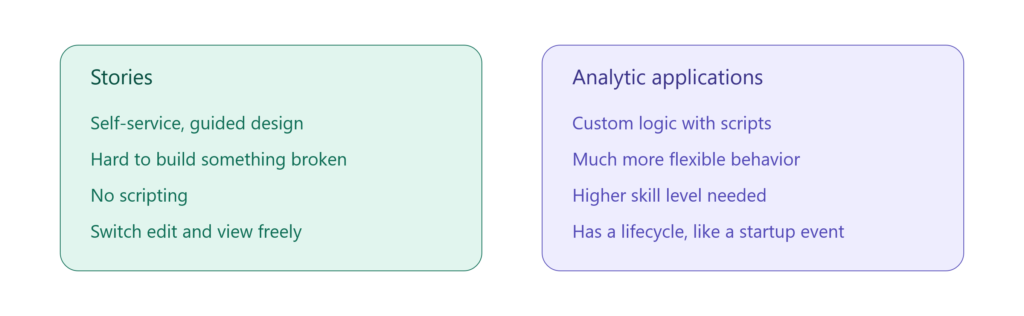
Stories and applications share many widgets and features, and end users should not be able to tell which one they are using. The difference is on the builder’s side.
Imag1: Side-by-side comparison of SAC stories and analytic applications
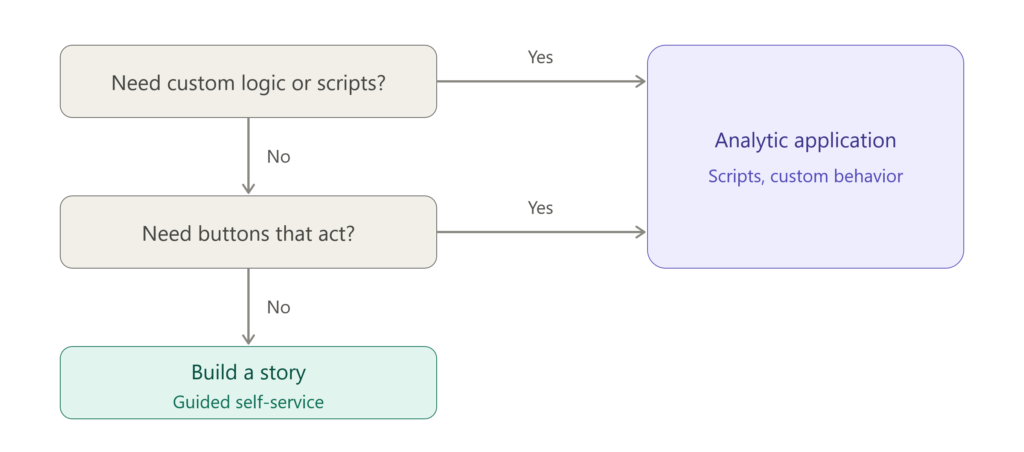
Imag2: Outlining the typical workflow for building analytic applications
Imag3: Exploring the designer workspace layout and widget events
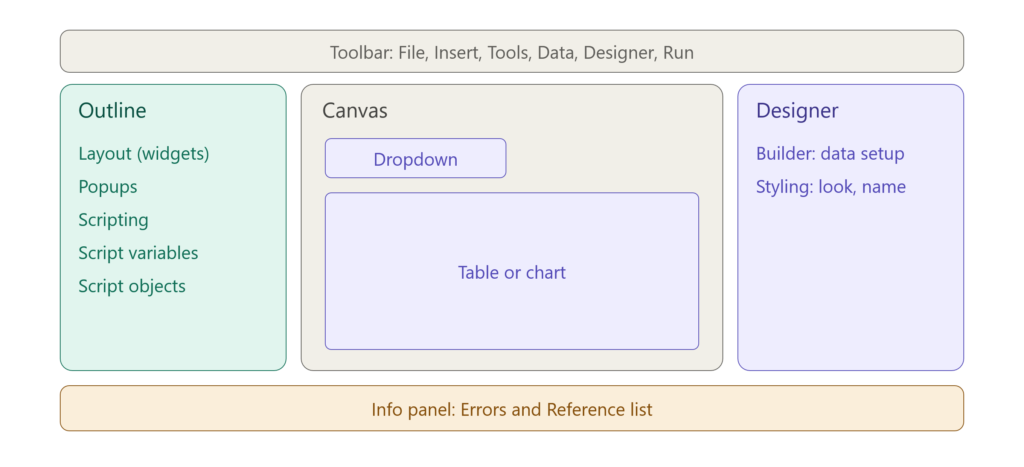
Image: Clarifying how application widgets handle separate data sources
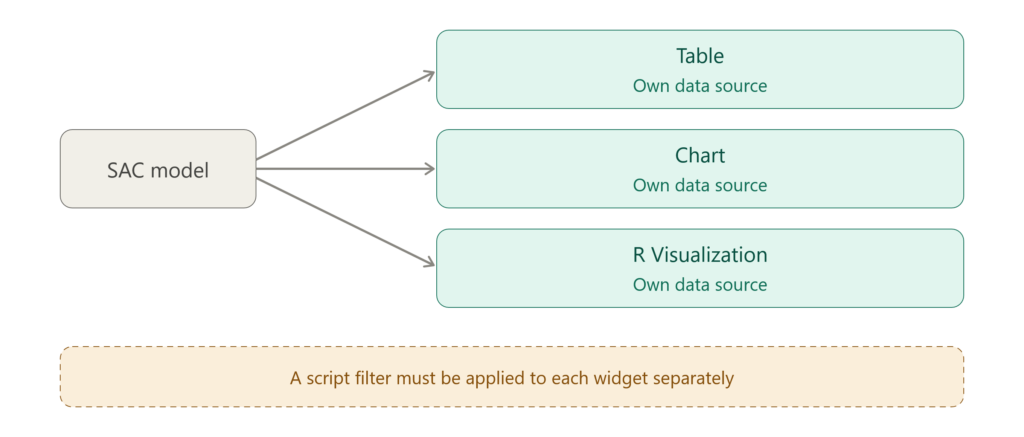
Image: Summarizing scripting basics and widget event lifecycle
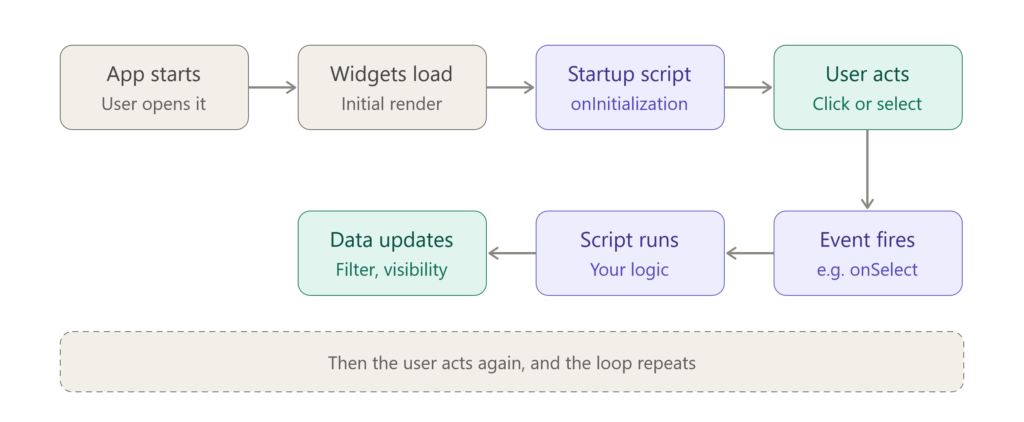
Image: Summarizing scripting limits and app access modes in SAC
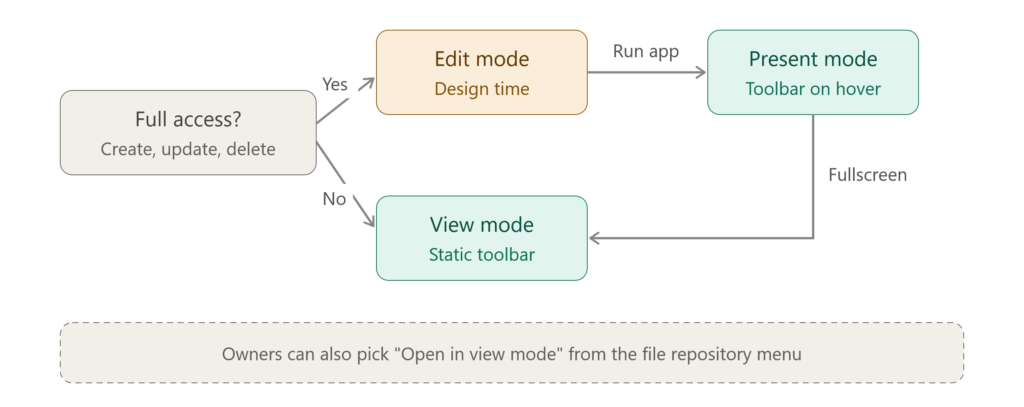
The mode appears in the URL as mode=edit, mode=present, or mode=view. There’s also mode=embed, which hides the toolbar.
Try it yourself: Create your first SAP Analytics Cloud analytics designer application
- Make sure you have the correct role and authorization in SAC like Application Creator role (or equivalent create, update, delete permissions). Without it, the Create menu would not offer the option.
- Click the menu icon, then Create, then Analytic Application.
- From the Insert menu, add a Table or Chart and pick a model as its data source.
- In the Outline, find your widget and note its name. That’s the name you will use in scripts.
- Save the application, then click Run Analytic Application.
- Check the address bar for
mode=present, then click Full screen and watch it change tomode=view.
Common beginner mistakes
- Expecting story features. Page filters and input controls don’t exist here. Use the Filter Line widget.
- Assuming widgets share data. A filter on one table won’t affect a chart on the same model.
- Sharing without edit rights. Others only get read access to applications in a public folder unless you share with them explicitly.
Quick check
- Which role lets someone create analytic applications? (Application Creator)
- Which mode does an app open in when you click Run from Edit mode? (Present)
- Do a table and a chart on the same model share a data source? (No, each has its own)
- What event runs once when an application starts?